The Opportunity
Engineering managers were flying blind. Git repositories held a full record of team activity — commit patterns, pull-request velocity, review bottlenecks, and contributor distribution — but turning that raw data into a useful team signal required custom queries and constant interpretation.
Gitalytics was built to close that gap. As the founding and only designer, I owned the product experience end to end: research, product strategy, interaction design, data visualization, brand, marketing, onboarding, and the visual system that held it all together.

01 · Finding the Product
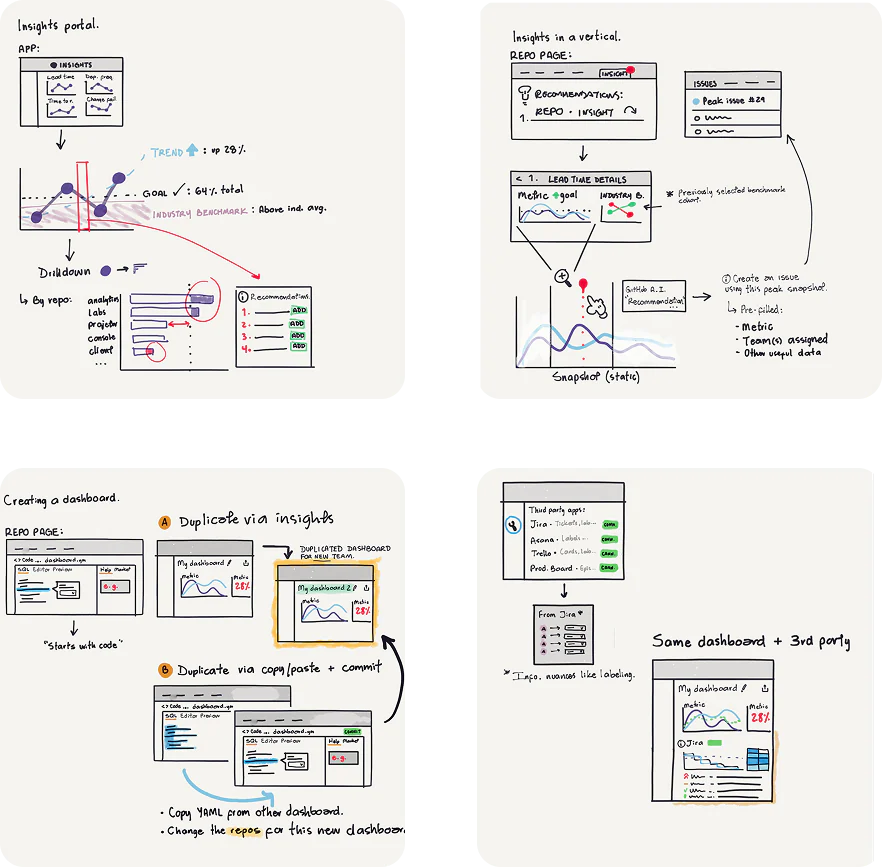
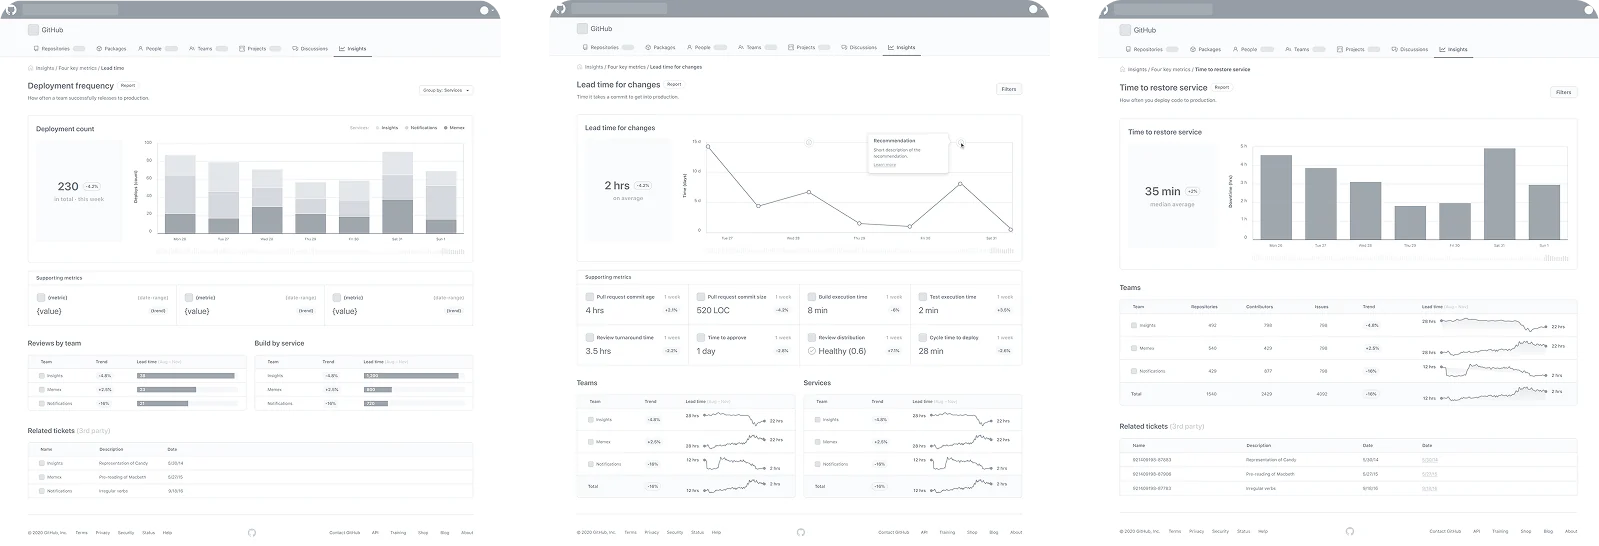
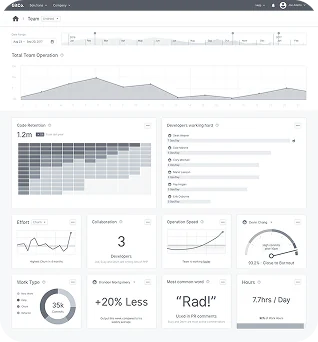
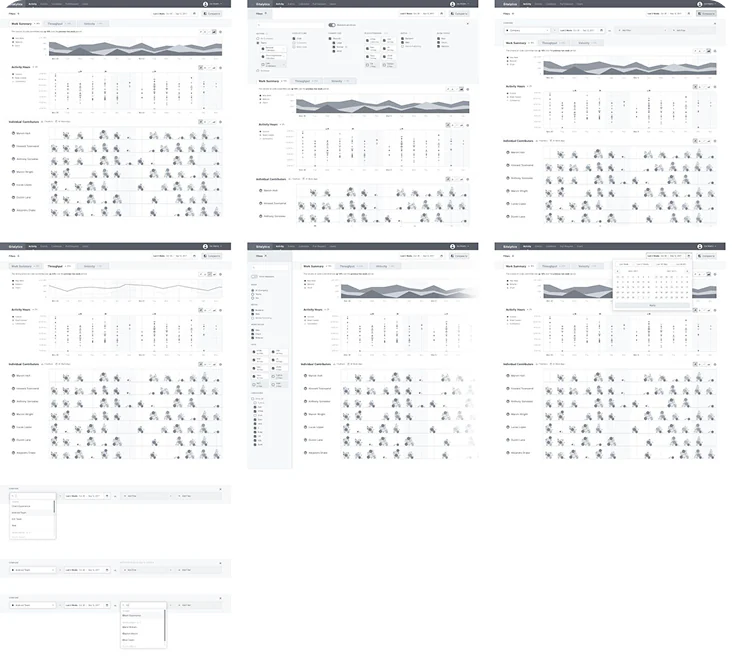
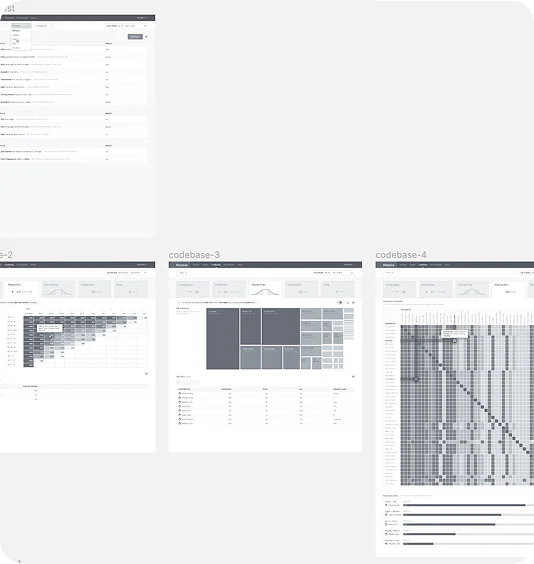
Early sketches, dashboard studies, and layout explorations show the product taking shape before there was a system to inherit.
From Metrics to Answers
Our first version was overbuilt: dense dashboards with every metric we could derive. Customer feedback was consistent — it was impressive, but overwhelming.
The turning point came from working alongside engineering leaders and reframing the experience around three questions:
- Where are we getting stuck?
- Who needs help?
- Are we improving?
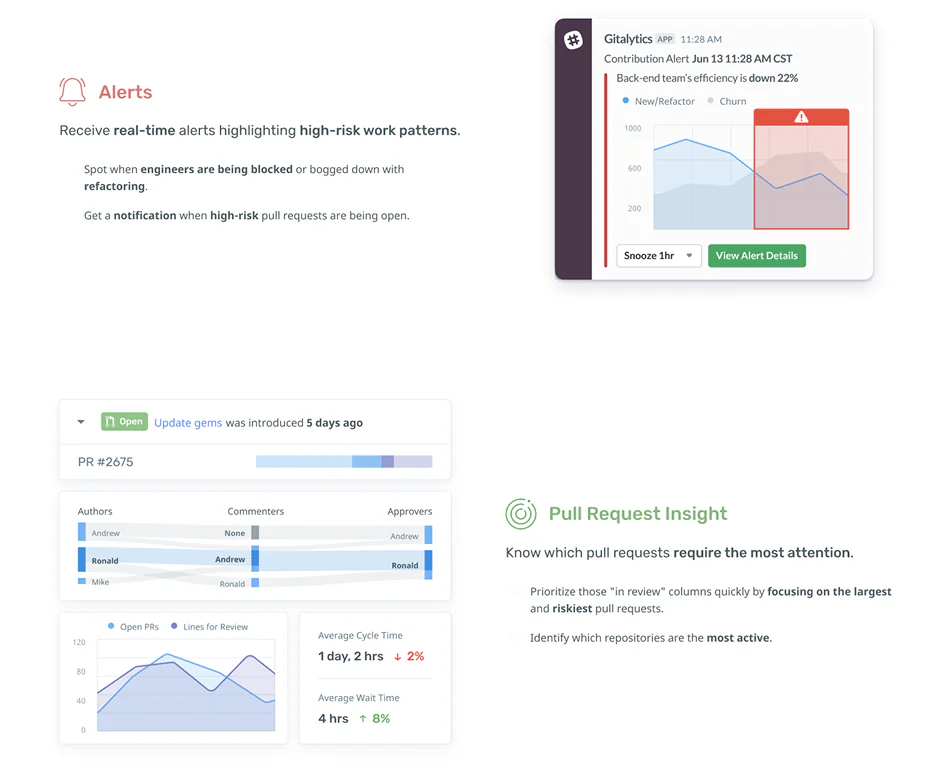
That changed both the information architecture and the visual language. We used progressive disclosure, stronger defaults, and alerts that brought the right signal into the workflow instead of asking managers to interpret a wall of charts.
02 · Building Gitalytics
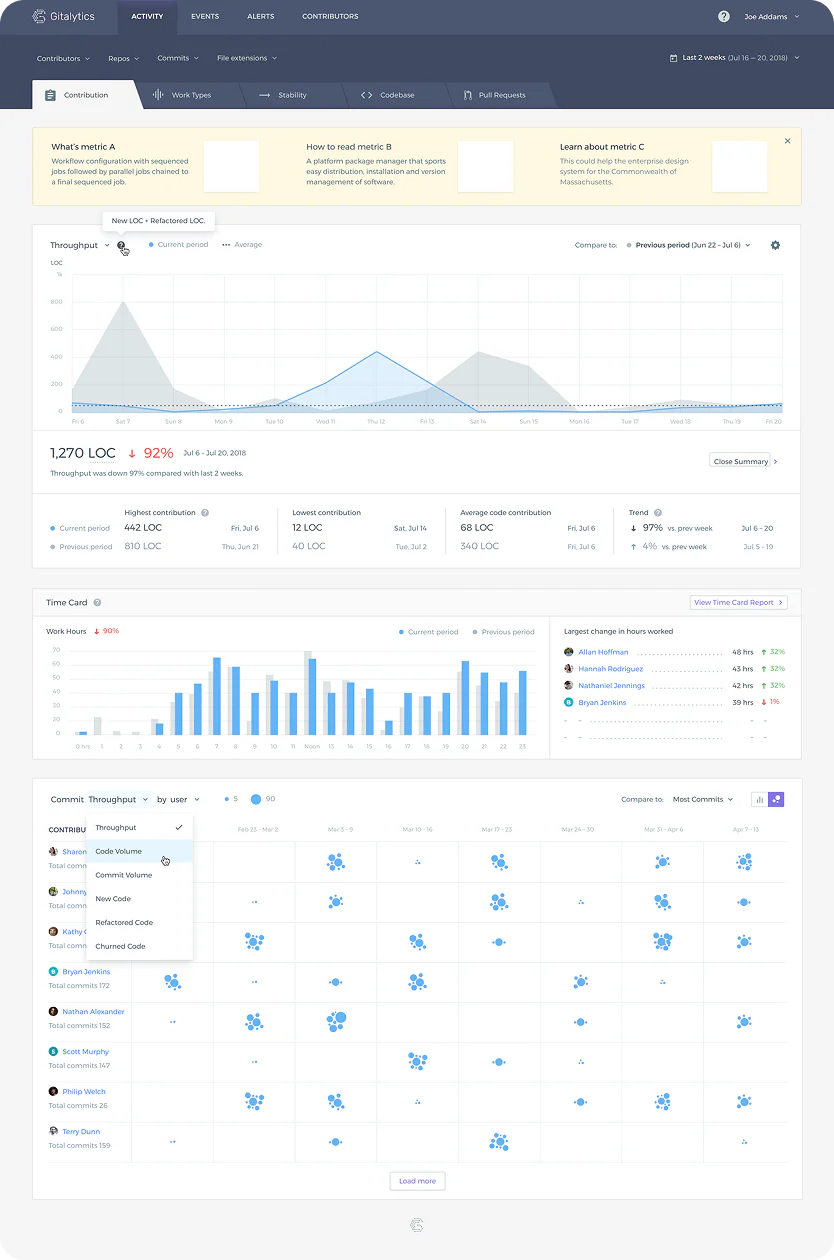
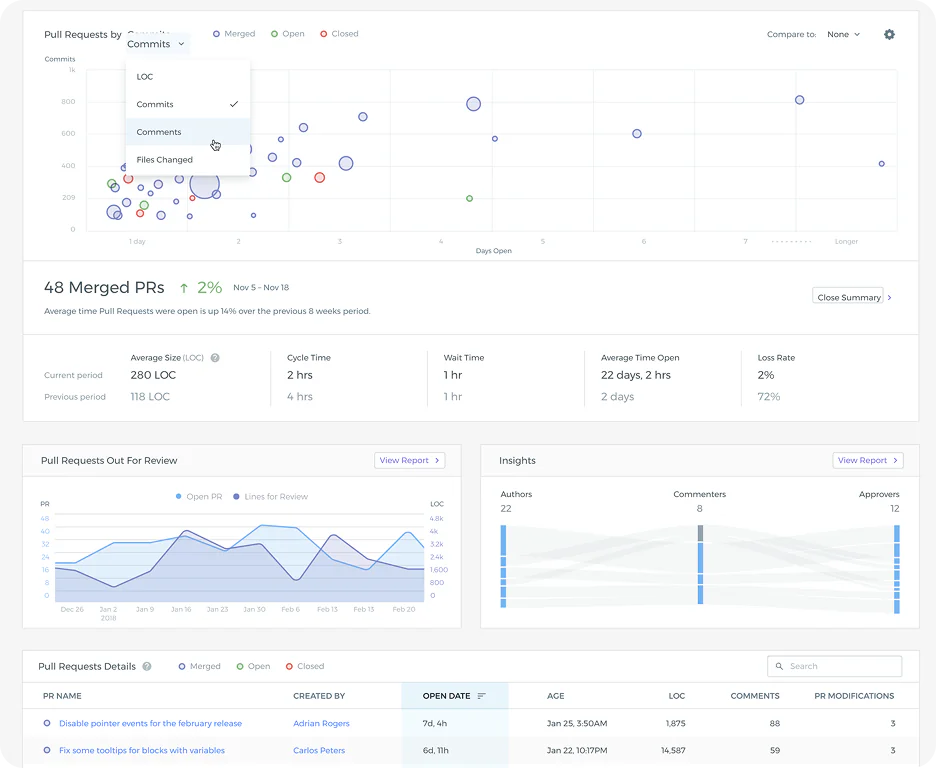
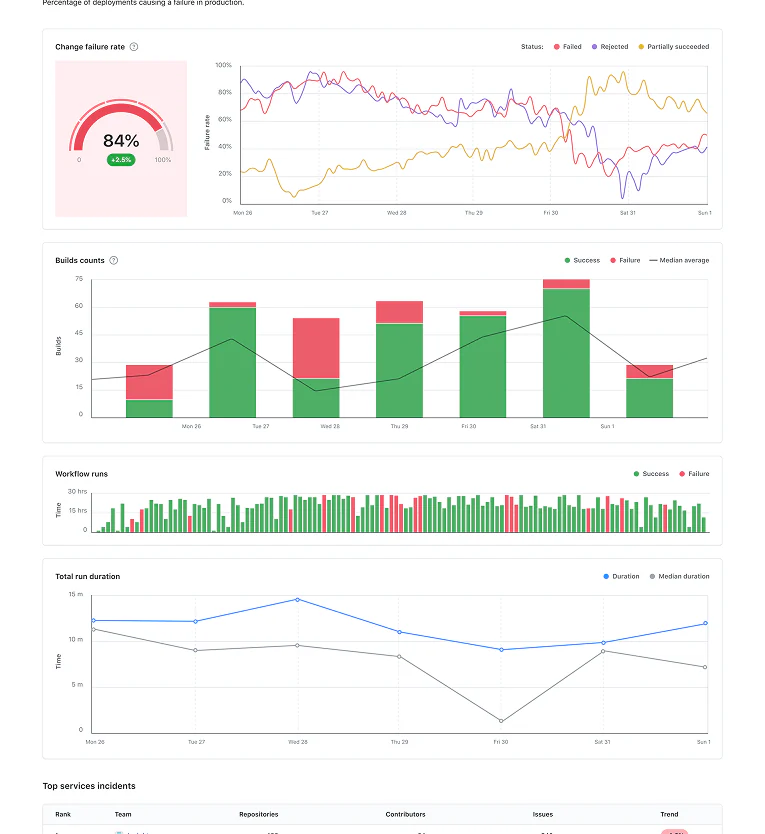
The product expanded from a single overview into connected views for activity, pull requests, alerts, and customizable engineering metrics.
Designing the Company, Not Just the Product
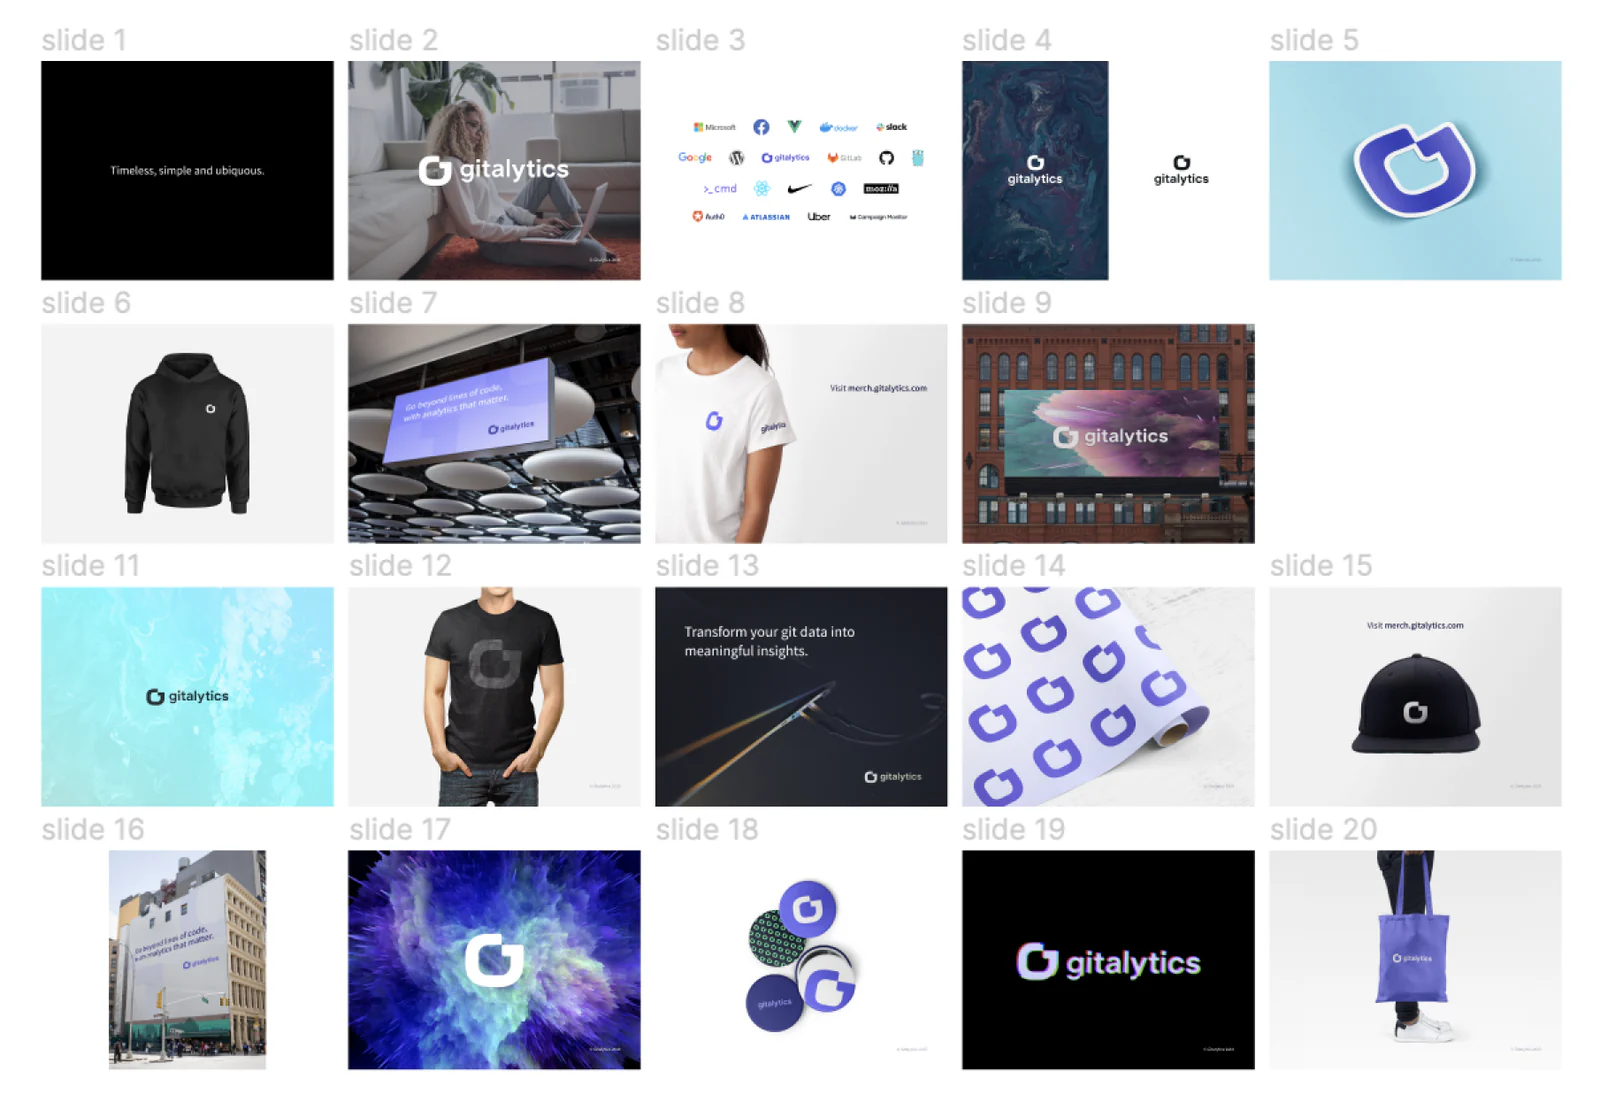
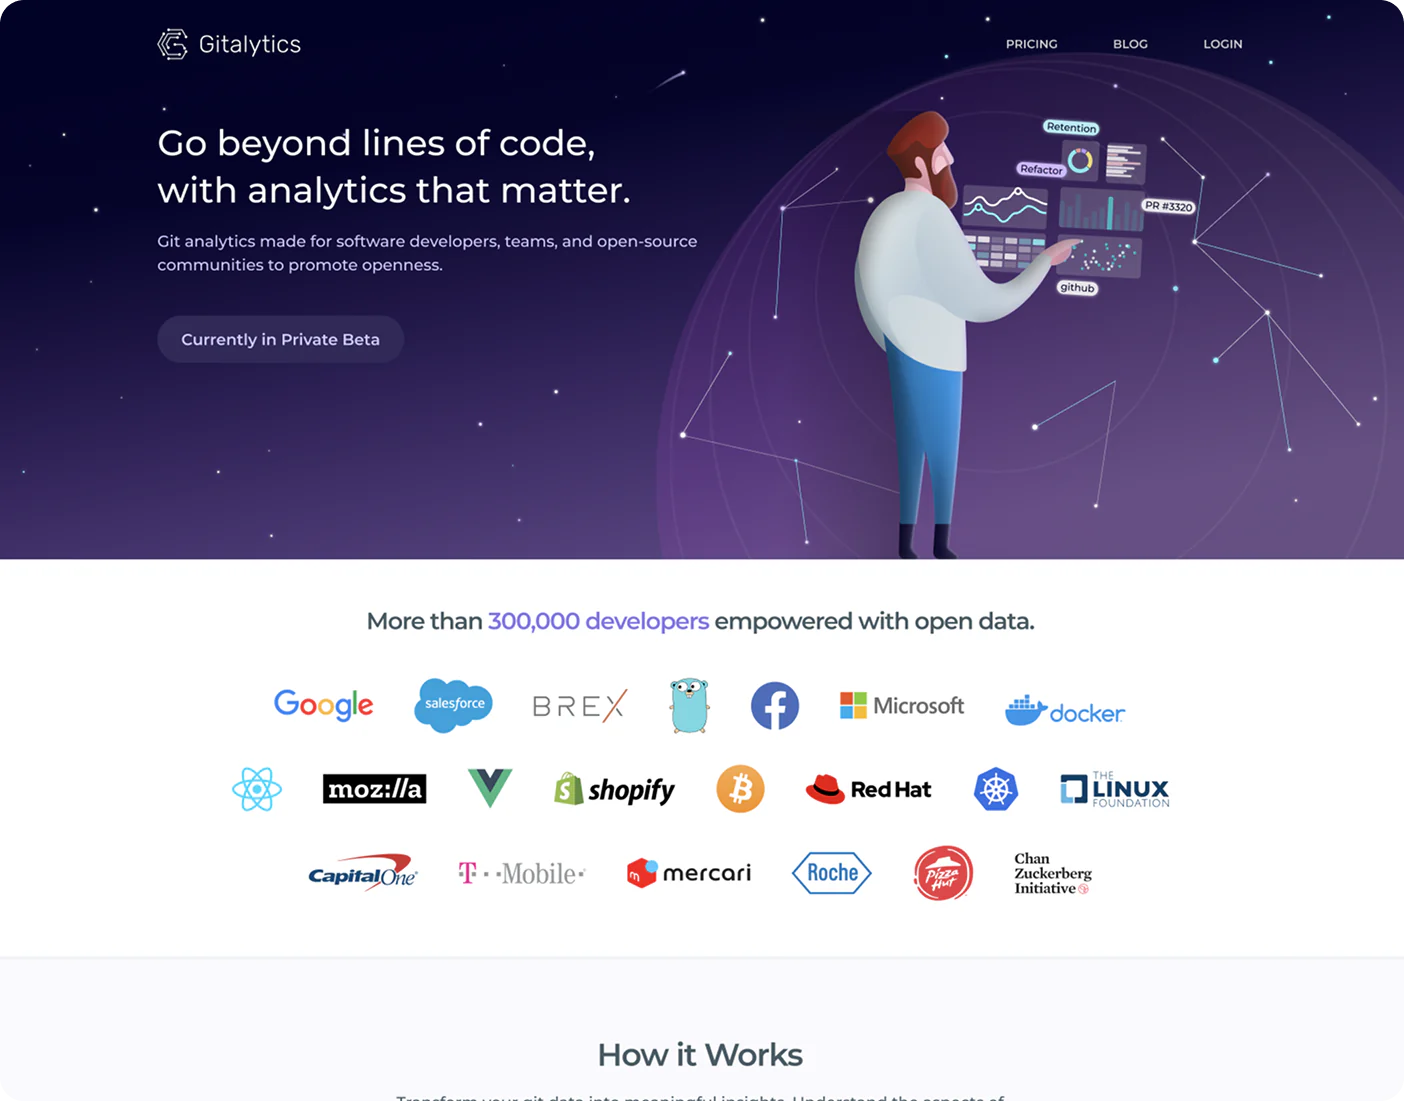
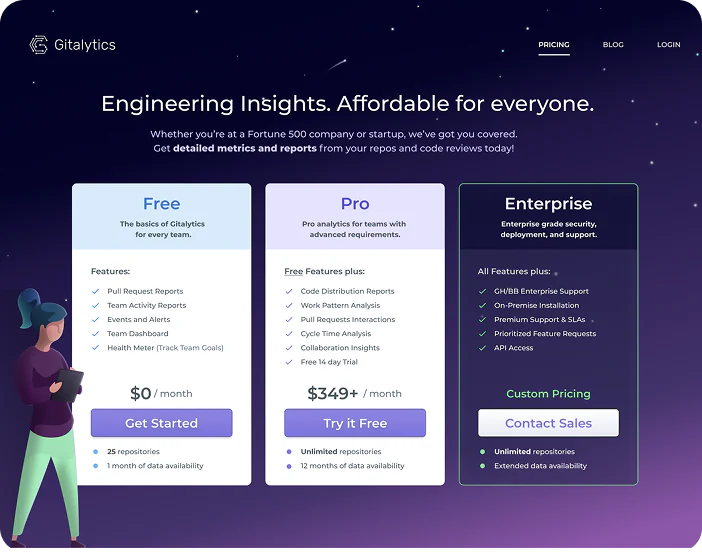
Being the solo designer meant every touchpoint had to tell the same story. I developed the visual identity, product illustrations, marketing pages, pricing, launch assets, and physical brand moments alongside the application itself.
That breadth was not decorative. It helped a technical product feel credible and coherent before the company had the resources of an established design organization.
03 · Making the Product Legible
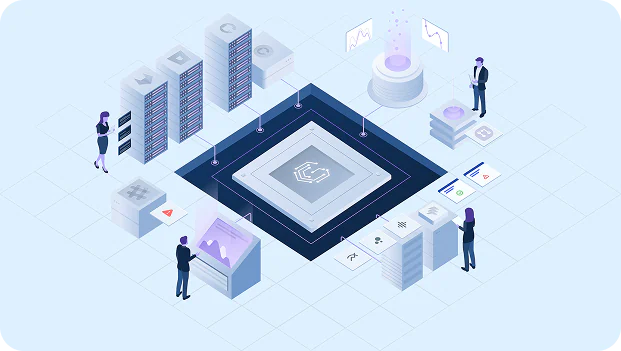
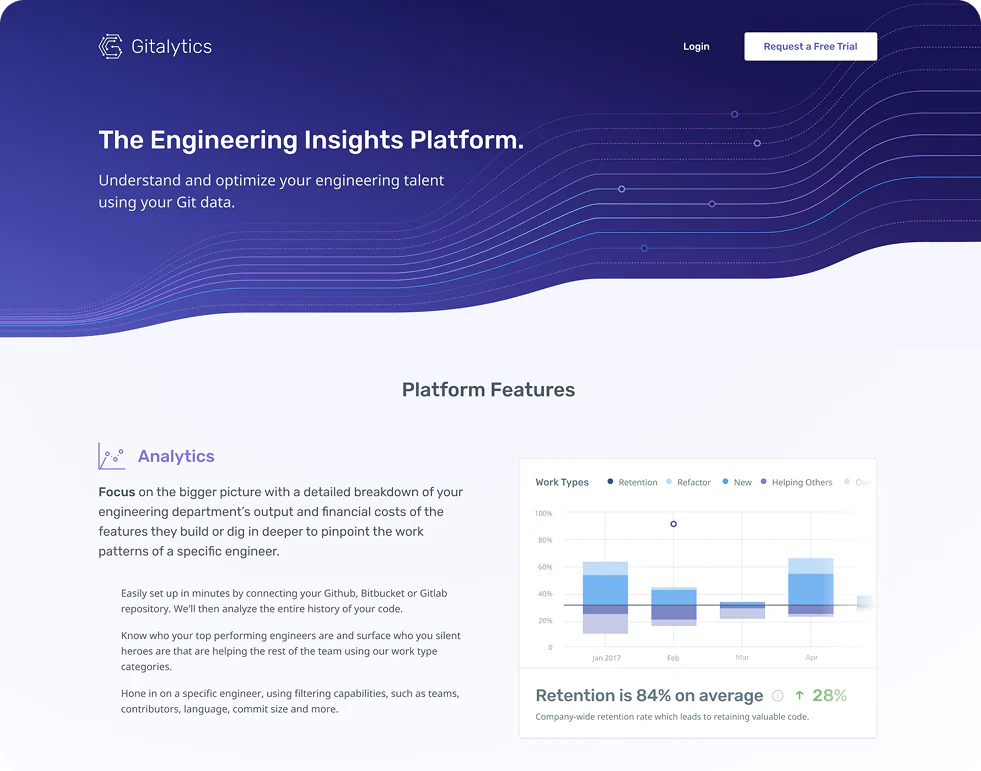
Brand, product storytelling, pricing, and workflow illustrations made an unfamiliar analytics category easier to understand and trust.


Scaling into GitHub Insights
After the acquisition, the challenge changed. Gitalytics had proved the value of engineering analytics; now the work had to feel native to GitHub and scale beyond a startup product.
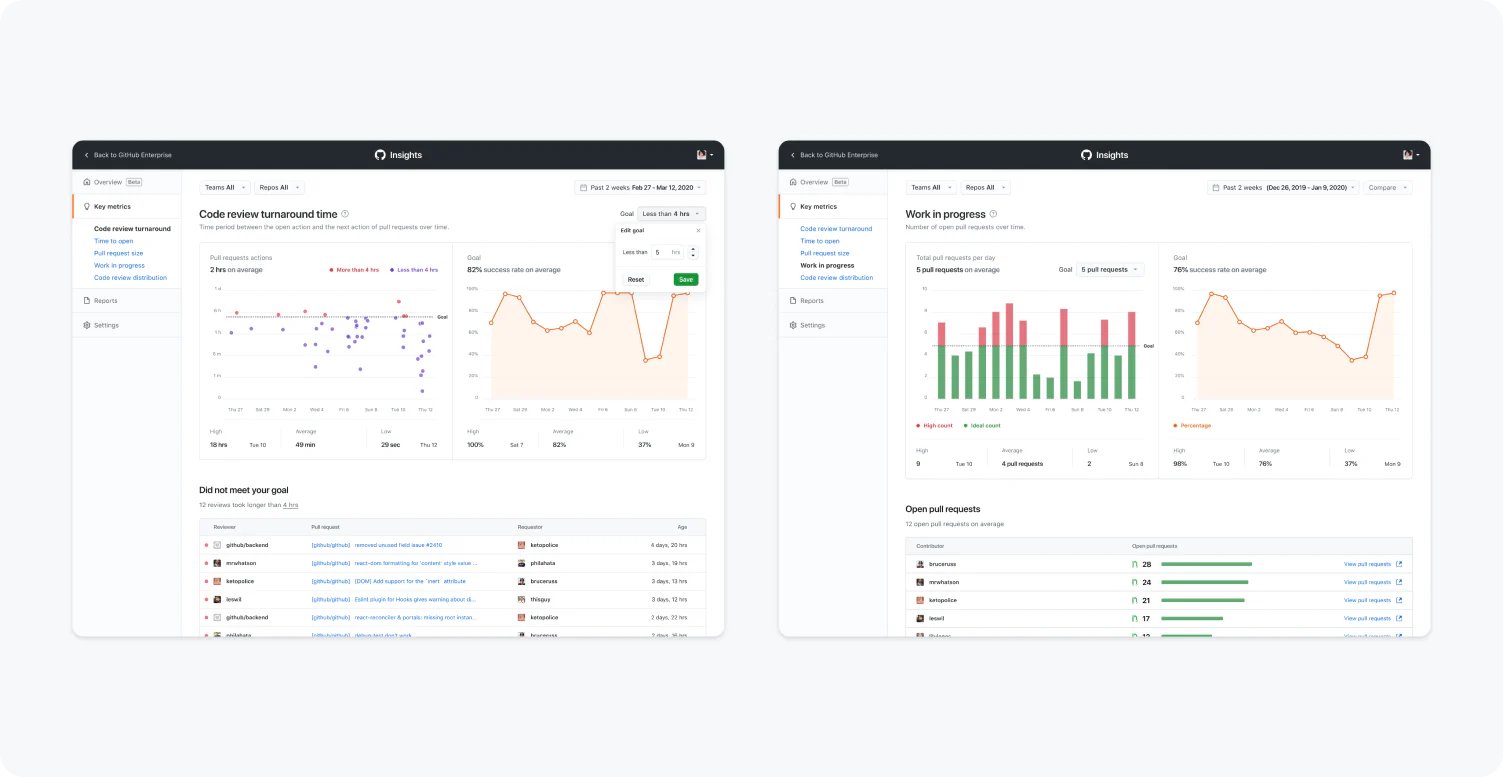
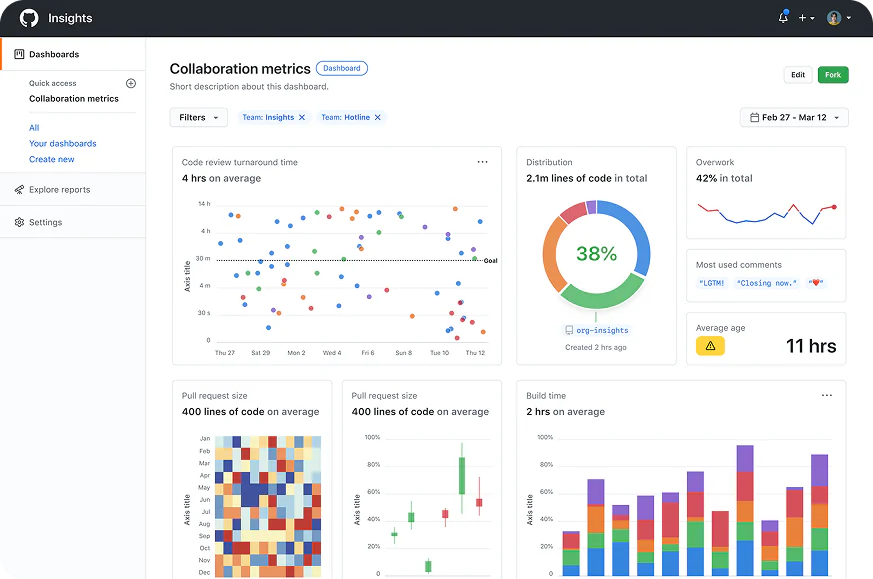
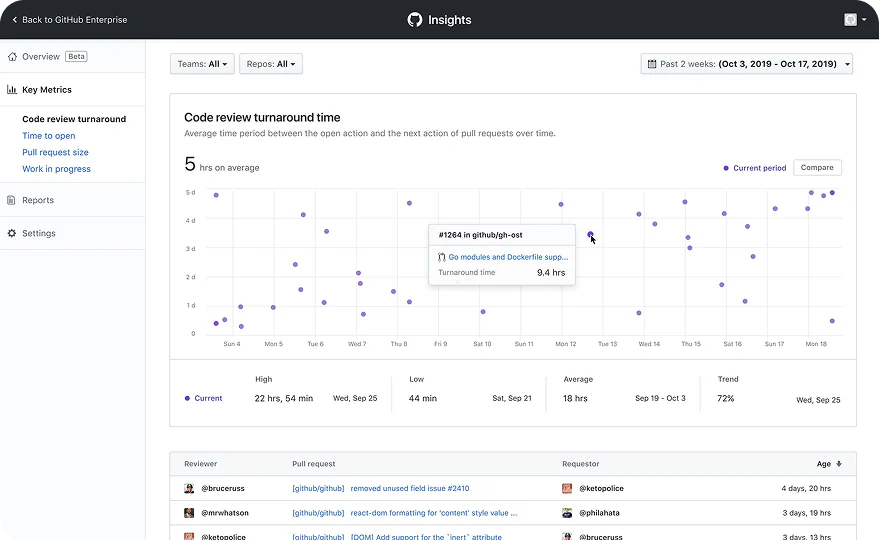
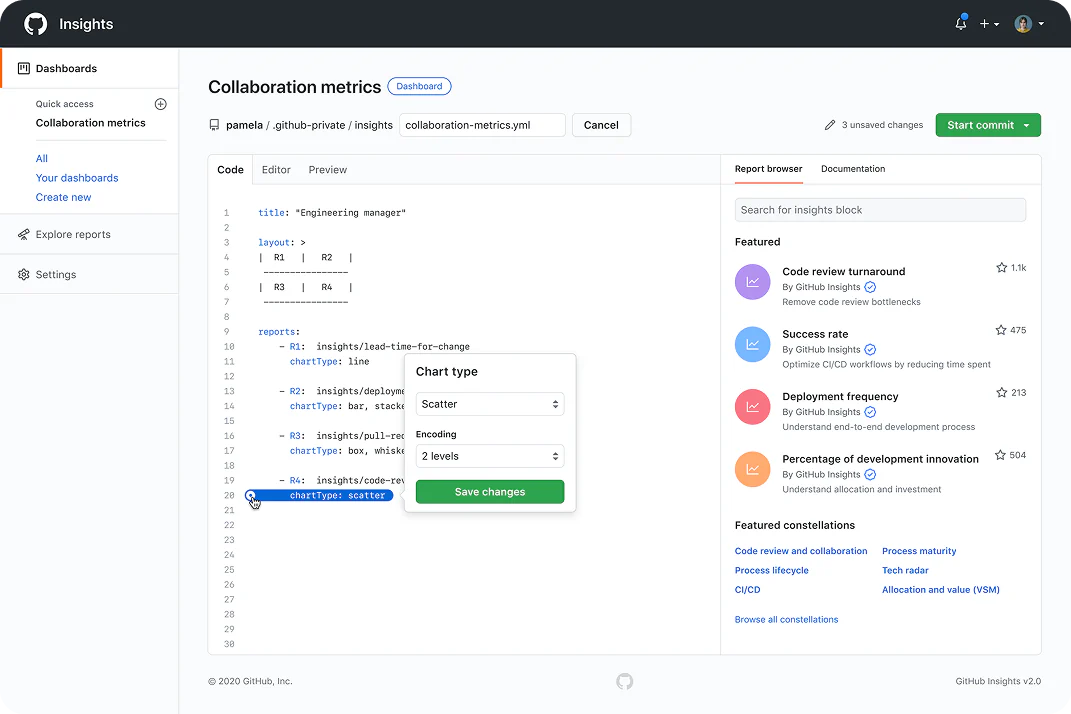
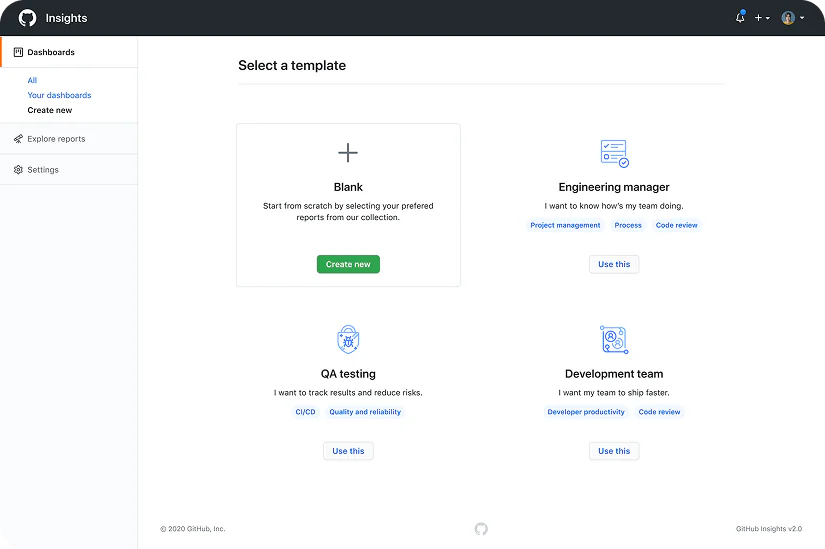
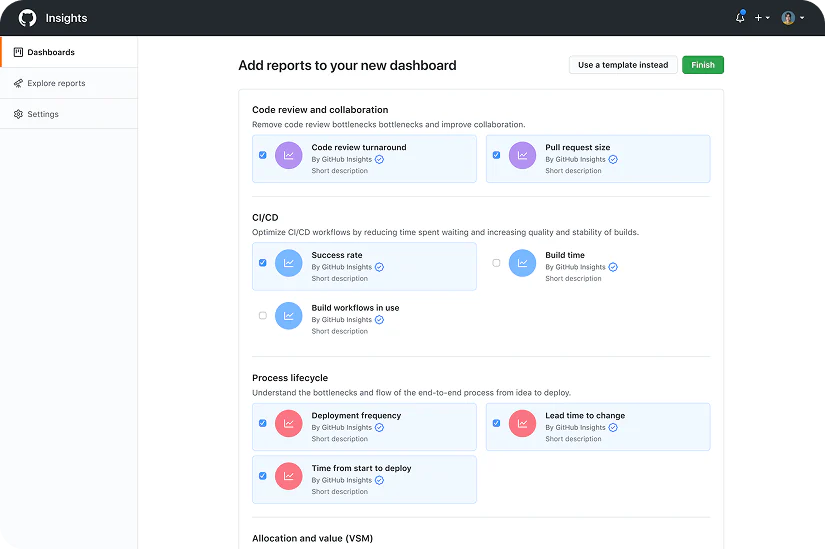
I evolved the experience into GitHub Insights: a system of ready-made templates, configurable dashboards, report-building workflows, and collaboration metrics grounded in the way teams already understood repositories and pull requests. The design moved from proving a category to integrating it into a platform used by developers every day.
04 · GitHub Insights
The acquired product matured into a GitHub-native system for collaboration health, code review, templates, and report composition.
“Gitalytics gave us insights we didn't know we needed. It changed how we think about team productivity.”
— VP Engineering, Series B startup
What This Built
Data visualization as a product language
Gitalytics is where I learned to choose a visual encoding by the question it answers — not by novelty — and to make dense quantitative systems scannable without stripping away their meaning.
Fluency in developer workflows
Designing around repositories, branches, pull requests, reviews, and deployment cycles gave me a durable intuition for technical users and the systems they inhabit.
Startup velocity with platform responsibility
Building from zero taught me speed and ruthless prioritization. Scaling the work inside GitHub taught me how those decisions change when a product becomes part of a larger ecosystem.
The lasting principle
The most useful analytics do not ask people to visit another dashboard. They surface the right signal, in the right workflow, at the moment someone can act on it.